Why Propensity Scoring Matters for Pipeline Management
Executive Summary
- Replace Gut Instinct with a Scored Engine: Most CRMs tell you deal stage and close date. Neither tells you probability.
- Quantify Win Probability: A propensity model (Propensity to Buy or P2B) assigns every open opportunity a score which enables marketers to break customers into two populations: likely to purchase or unlikely to purchase (or churn, respond, etc.). P2B models are grounded in what separated Closed Won from Closed Lost historically. This was one of my first marketing models.
- Prioritize Ruthlessly: Sales teams can rank and work on their highest-scoring deals first. Marketing can re-engage the right accounts at the right time. RevOps can build a forecast on probability rather than stage-weighted guesses.
- The Key Word is Historical: The model learns from resolved deals and applies that learning forward. That distinction shapes every decision in how we build this — and is why data leakage is the most dangerous mistake you can make.
- Operational, Not Academic: A 0.916 AUC on the hold-out test set (accurate for win/loss or buy/no buy 92% of the time) model built on CRM data you already have is not a research project. It can slot into Salesforce as a scored field and feed your weekly pipeline review.
Introduction
The Lead Scoring Challenge Challenge
In Part 1 Accelerating the Revenue Engine, I explored our B2B Salesforce pipeline through exploratory data analysis — profiling deal velocity, mapping funnel conversion rates, and segmenting accounts with RFM. We learned what the pipeline looked like. Part 2 is about learning what it predicts.
The question I am answering: Given everything we know about an opportunity at the moment of SQL (Sales Qualified Lead), can we predict whether it will close won?
That’s a propensity-to-win model where we have replaced the purchase target with a target of won opportunity likelihood. And in a B2B pipeline context, it is one of the highest-leverage analytical tools you can give a revenue team. On a related note, classifiers can be used by marketers to predict a number of different outcomes. My first propensity model was statistical classification tree model of “likely-to-respond” to email campaigns and my teams have also built “propensity-to-churn” models for retention. I’ve been relying on propensity models ever since.
Most CRMs tell you deal stage and close date. Neither of those tells you probability. Reps are optimistic. Managers discount everything. The result is a pipeline review that’s more theater than science. Davenport & Harris (2017) found that predictive analytics were a sustainable competitive advantage some years ago:
” … many companies in a variety of industries are enhancing their CRM … capabilities with predictive analytics, and they are enjoying market-leading growth and performance as a result.”
By developing and deploying a propensity to purchase (or opportunity closed won) model high scoring opportunities can be routed to account managers or partners without delay, leaving the lower scoring opportunities in the queue for SDR follow-up or nurture programs.
A Note on Data Integrity and Ethics
To maintain the highest ethical standards and ensure zero overlap with proprietary information from past or current employers, the analysis in this series is conducted on a high-fidelity synthetic dataset.
This environment was custom-built for The Marketing Science Signal using Python-based generative scripts designed to mimic the complexities of a multi-year B2B enterprise funnel and demonstrate enterprise-grade diagnostic techniques without compromising proprietary data.
- Stochastic Modeling: Lead progression and conversion rates are governed by probability distributions rather than simple linear logic.
- Engineered Noise: Intentional “structural nulls” and data entry inconsistencies were injected to replicate real-world CRM friction.
- Behavioral Realism: Account tiers and engagement metrics were calibrated to reflect actual B2B buying cycles.
The Dataset and Target Variable
The synthetic B2B pipeline dataset contains 1,000 opportunities across 45 columns — firmographic attributes, engagement signals, stage velocity metrics, and RFM scores developed in Part 1.
For modeling, I filter to closed deals only: Closed Won (n=181, 55%) and Closed Lost (n=148, 45%). Open and Disqualified records are excluded — they haven’t told us their outcome yet and cannot train the model.
The binary target is straightforward:
- Closed Won = 1
- Closed Lost = 0
The class split is nearly balanced at 55/45, which is favorable. I still apply scale_pos_weight to handle the imbalance formally, but this dataset won’t require a heavy correction.
Feature Engineering: Three Tiers
36 features across three tiers were constructed for this model.
Tier 1 — Categorical (7 features)
Firmographic and campaign attributes: Industry, Company Size, Account Tier, Region, Lead Source, Campaign Type, and RFM Segment.
| Deliberate Exclusion: Forecast_Category — This field (Pipeline, Best Case, Commit, Closed) is updated by reps as deals progress toward close. Including it would be data leakage: the model would learn from information that simply does not exist on open opportunities at prediction time. A model that cheats on training data will fail in production. I removed it. |
Tier 2 — Numeric & Velocity (19 features)
Deal size (Amount), engagement counts (N_Touches, Email_Opens, Content_Downloads), all nine stage-transition velocity metrics, total cycle days, and the RFM component scores (R, F, M).
Tier 3 — Derived (10 features)
Log-transformed versions of skewed engagement counts, binary flags for whether each pipeline stage was reached, and a Max_Stage_Reached rollup. The stage reach flags are particularly important — they encode the shape of the deal’s journey in a format the model can use directly.
Model Architecture: XGBoost
Although it should be noted that in school we are taught to try three different statistical/ML techniques to find the method with the highest predictive accuracy, for this article I chose XGBoost (EXtreme Gradient Boosting which is a popular ML technique that builds an ensemble of trees sequentially, improving on each iteration to decrease error and known for speed and accuracy) for several reasons that are directly relevant to CRM data. It handles mixed feature types — categorical and numeric — efficiently, requiring only ordinal encoding for categoricals rather than the complex one-hot expansion that most linear models demand. It is robust to outliers and missing values, both of which are endemic to real pipeline data. And critically, it produces probability scores between 0 and 1 that are suitable for propensity ranking — which is what this model actually requires. While a ‘textbook’ approach might involve testing multiple algorithms (Random Forest, LightGBM, etc.), I have standardized on XGBoost for this use case. In a production RevOps environment, the ability to handle mixed data types and produce calibrated probability scores—not just classifications—is what separates a research artifact from a revenue asset.
| Parameter | Value | Rationale |
| n_estimators | 400 | Ceiling — early stopping determines the actual tree count |
| max_depth | 5 | Controls tree complexity; limits overfitting |
| learning_rate | 0.05 | Conservative rate; designed to pair with early stopping |
| scale_pos_weight | 0.818 | Corrects for the 55/45 class imbalance |
| early_stopping_rounds | 30 | Halts training when validation AUC stops improving |
| eval_metric | auc | Optimizes for ranking, not raw accuracy |
The model’s best AUC on the validation set was achieved at iteration 3, after which performance plateaued for the subsequent 30 rounds before early stopping halted training at tree 33. With 263 training rows, the dominant patterns are learned in the first three trees; additional estimators fit noise rather than signal. More historical data would push the best iteration substantially higher.
Model Performance
Cross-Validation
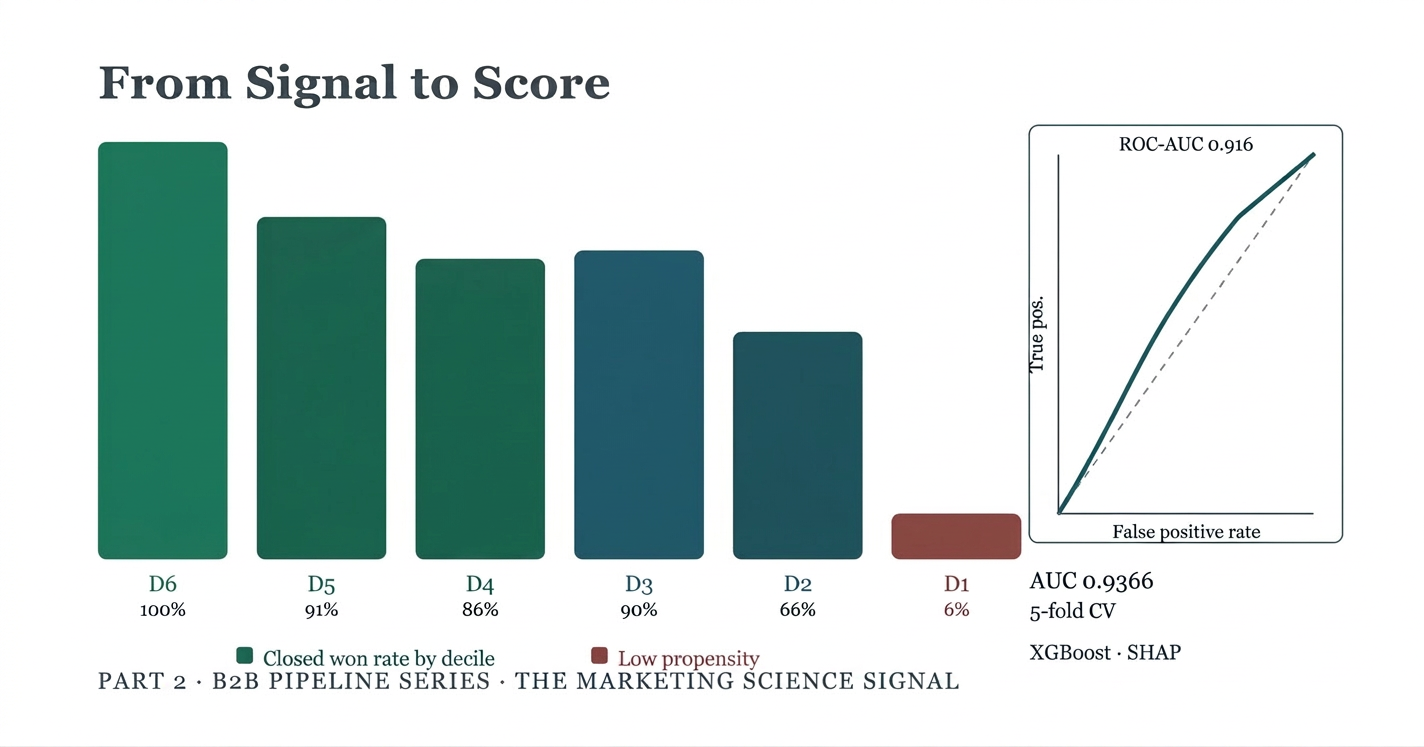
The 80/20 split was stratified on the target variable, preserving the 55/45 class ratio in both training and test sets. Five-fold stratified cross-validation was then applied to the training set alone and produced a ROC-AUC of 0.9366 ± 0.0167.
| Fold | AUC |
| 1 | 0.9605 |
| 2 | 0.9131 |
| 3 | 0.9490 |
| 4 | 0.9348 |
| 5 | 0.9258 |
The variance across folds is tight (±0.017), indicating a stable model. Fold 2 is the lowest at 0.913 — worth inspecting which accounts or industries fall into that fold and whether they are underrepresented in training data.
Hold-Out Test Set (20%, n=66)
| Metric | Score |
| ROC-AUC | 0.9157 |
| Average Precision | 0.9070 |
| Accuracy | 0.89 |
Classification Report at 0.5 Threshold:
| Class | Precision | Recall | F1 | Support |
| Closed Lost | 0.93 | 0.83 | 0.88 | 30 |
| Closed Won | 0.87 | 0.94 | 0.91 | 36 |
| Weighted avg | 0.90 | 0.89 | 0.89 | 66 |
A few things stand out here. The model is slightly more conservative on Closed Lost predictions — high precision (0.93) but lower recall (0.83), meaning it misses about 17% of actual losses and labels them as potential wins. On the Closed Won side, recall is strong at 0.94, which is exactly what you want in a sales prioritization context: you do not want to deprioritize deals that will close. In GTM sales and marketing, I always recommend a more aggressive model that is tolerant of mistakenly classifying some lost opportunities as won, in order not to “leave anything on the table” by also identifying some potential wins as potential losses.

Miller (2015) states that “the area under the ROC curve provides an index of predictive accuracy independently of the probability cut-off that is being used to classify cases.” Perfect prediction corresponds to an area of 1.0 (curve that touches the top-left corner). An area of 0.5 depicts random (null-model) predictive accuracy. An AUC of 0.916 on a 263-record training dataset is strong. The natural question is whether it holds at scale. That is exactly the argument for refreshing this model as the pipeline grows — more data, more signal, sharper separation.

Strategic Implication: At the current sample size, this model is production-ready for pipeline prioritization. It is not yet ready to replace a full probabilistic forecast. That is a Part 3 conversation.
What Drives Closed Won? The SHAP Story
Feature importance by gain tells you which variables the model used most. SHAP values tell you how they were used (the direction and magnitude on each individual prediction). These are not the same thing, and both matter. Given that this is a customer dataset, it is not surprising that purchase behavior is highly influential (customer monetary value, purchase frequency and recency as part of the RFM Segment). For prospecting, less influential fields such as email opens, content downloads and lead source have to be relied upon in the absence of past purchase data. In my experience, supplementing internal CRM data with syndicated 3rd party aggregated data such as competitive installations, off-premise media usage and purchase intent, firmographics and IT or other budget data is critical to identify customer look-alikes from among the prospect opportunities.

From the SHAP summary, the model’s strongest signals primarily related to purchase and velocity data:
- Stage Reach Flags: Deals that progressed through Stage 3 (Proposal) and Stage 4 (Negotiation) are strongly associated with Closed Won. This isn’t surprising but quantifying it gives you a defensible basis for pipeline stage-weighting in your forecast model.
- Total Cycle Days and Velocity Metrics: Faster progression through early stages correlates with winning. Stalls — particularly between Stage 2 and Stage 3 — are a loss indicator. This is consistent with the Stage 2→3 stagnation finding in Part 1.
- RFM Scores: Higher Monetary and Frequency scores at the account level are predictive of win. Accounts with a track record of buying behavior carry that signal forward into new opportunities.
- Deal Size (Amount): There is a non-linear relationship here: mid-range deals close at higher rates than the very large or the very small, likely reflecting complexity and budget cycle dynamics at the extremes.

Strategic Implication: The stage reach flags and velocity metrics are the model’s highest-leverage signals. If you want to move the needle on win rate, focus intervention on the Stage 2→3 transition — the data is telling you that is where deals are won or lost.
The Decile Lift Table: Making It Operational
The model becomes actionable through decile scoring. Every resolved opportunity is assigned a propensity score and bucketed into a decile. Here is what that looks like on this dataset:
| Decile | n | Closed Won | Win Rate | Lift vs. Baseline |
| D6 (top) | 57 | 57 | 100.0% | 1.82x |
| D5 | 32 | 29 | 90.6% | 1.65x |
| D4 | 43 | 37 | 86.0% | 1.56x |
| D3 | 30 | 27 | 90.0% | 1.64x |
| D2 | 35 | 23 | 65.7% | 1.19x |
| D1 (bottom) | 132 | 8 | 6.1% | 0.11x |
Baseline win rate: 55.0%
The separation is stark. The top decile (or 20%) of opportunities closed at 100%. Every opportunity the model ranked highest won. The bottom decile closed at 6.1%, an 89-point spread. If a rep is choosing between two deals to prioritize this week, this table tells them everything they need to know.
| Why Only Six Deciles? With 329 scored records, the score distribution does not have enough granularity to create ten non-overlapping quantile bins. At 2,000+ records you would expect clean decile separation. The pattern is valid; the binning is constrained by current sample size. This is a known artifact of small-n propensity modeling. |
Limitations and What Comes Next
Sample Size
329 training records is enough to demonstrate the method and produce a working model, but a production propensity model on a real pipeline wants 2,000–5,000+ resolved opportunities at minimum. Every new closed deal — won or lost — improves the model. This is an argument for instrumenting your pipeline now and refreshing the model quarterly.
Feature Leakage Risk
I removed Forecast_Category deliberately because it introduces look-ahead bias—giving the model information from the ‘future’ that won’t be available at the moment of prediction. So it is “leaking” data from the target variable into the training data. It is worth auditing other velocity features on the same grounds. For example, Total_Cycle_Days is only fully known once a deal closes; therefore, to move this model into production, that feature would be replaced with ‘elapsed days’ at the time of scoring. The notebook flags these variables now; operationalizing that transition is a Part 3 conversation.
Threshold Tuning
I evaluated at a default 0.5 threshold. For a sales prioritization use case, you may want to lower the threshold — catch more potential wins at the cost of some false positives — or raise it to surface only very high-confidence deals. That tradeoff depends on your team’s capacity and pipeline velocity.
Model Refresh Cadence
Markets change, sales playbooks evolve, and pipeline composition shifts. A propensity model trained on last year’s deals needs retraining — quarterly at minimum, monthly if your pipeline is active. I will cover the refresh architecture in Part 3.
The Bigger Picture
A 0.916 AUC propensity model built on CRM data you already have, using features your team already tracks, is not a research project. It is an operational asset. It can slot into your CRM as a scored field, feed into your weekly pipeline review, and give your forecast model a probabilistic foundation instead of a stage-weighted guess.
Part 3 will cover how to operationalize this model on open opportunities — scoring live deals, handling temporal feature construction, and building a refresh pipeline.
Questions or feedback? Reach out at mikesdatamarketing.com.
Academic & Technical Citations
Michael E. Foley (2026). “B2B Pipeline Optimization, Part 2: Building a Propensity Model to Predict Closed Won.” The Marketing Science Signal. mikesdatamarketing.com
bibtext
@article{foley2026propensity, author = {Foley, Michael E.}, title = {From Signal to Score: Building a Propensity Model That Predicts Closed Won}, journal = {The Marketing Science Signal}, year = {2026}, month = {April}, day = {26}, url = {https://mikesdatamarketing.com/2026/04/26/from-signal-to-score-building-a-propensity-model-that-predicts-closed-won/}, keywords = {Propensity Modeling, XGBoost, Binary Classification, B2B Pipeline, CRM Scoring, SHAP, Decile Lift, Sales Prioritization}}
Further Reading & Technical References
Chen, T., & Guestrin, C. (2016). “XGBoost: A Scalable Tree Boosting System.” Proceedings of the 22nd ACM SIGKDD International Conference. [Foundational paper for the XGBoost algorithm.]
Davenport, T. H., & Harris, J. G. (2017). Competing on Analytics: Updated, with a New Introduction: The New Science of Winning. Harvard Business Review Press. [The definitive guide on how organizations build competitive advantage through the systematic use of predictive modeling and statistical analysis.]
Fader, P. S., & Hardie, B. G. (2009). “Probability Models for Customer-Base Analysis.” Journal of Interactive Marketing. [Foundational theory for the RFM segmentation applied in the feature set.]
Lundberg, S. M., & Lee, S. I. (2017). “A Unified Approach to Interpreting Model Predictions.” Advances in Neural Information Processing Systems (NeurIPS). [The SHAP framework used for model explainability.]
Miller, Thomas W. (2015). Marketing Data Science: Modeling Techniques in Predictive Analytics with R and Python. Pearson FT Press. [A comprehensive treatment of marketing applications in predictive analytics, specifically addressing lead targeting, lift charts, and sales forecasting.]
Tukey, J. W. (1977). Exploratory Data Analysis. Addison-Wesley. [The gold standard for the data profiling methodology applied in Part 1.]
Technical Keywords & Methodology Index
- Methodology: Propensity Modeling, Binary Classification, XGBoost, Feature Engineering, SHAP Explainability, Decile Lift Analysis.
- Statistical Concepts: ROC-AUC, Average Precision, Stratified Cross-Validation, Class Imbalance (scale_pos_weight), Precision-Recall Tradeoff.
- Feature Engineering: Log Transformation, Stage Reach Flags, Ordinal Encoding, Data Leakage Prevention.
- Business Intelligence: Pipeline Propensity Scoring, Decile Lift Table, Sales Prioritization, CRM-Integrated Scoring, Pipeline Risk Quantification, Revenue Velocity Analysis.
- MLOps: Feature Temporal Validity, Look-Ahead Bias Mitigation.
Leave a Reply