Pipeline management is rarely a linear path. While current views focus on meeting the quarter’s revenue targets, in my experience true pipeline health requires a “human-in-the-loop” approach that monitors leading indicators up to three quarters out to allow for proactive adjustments.
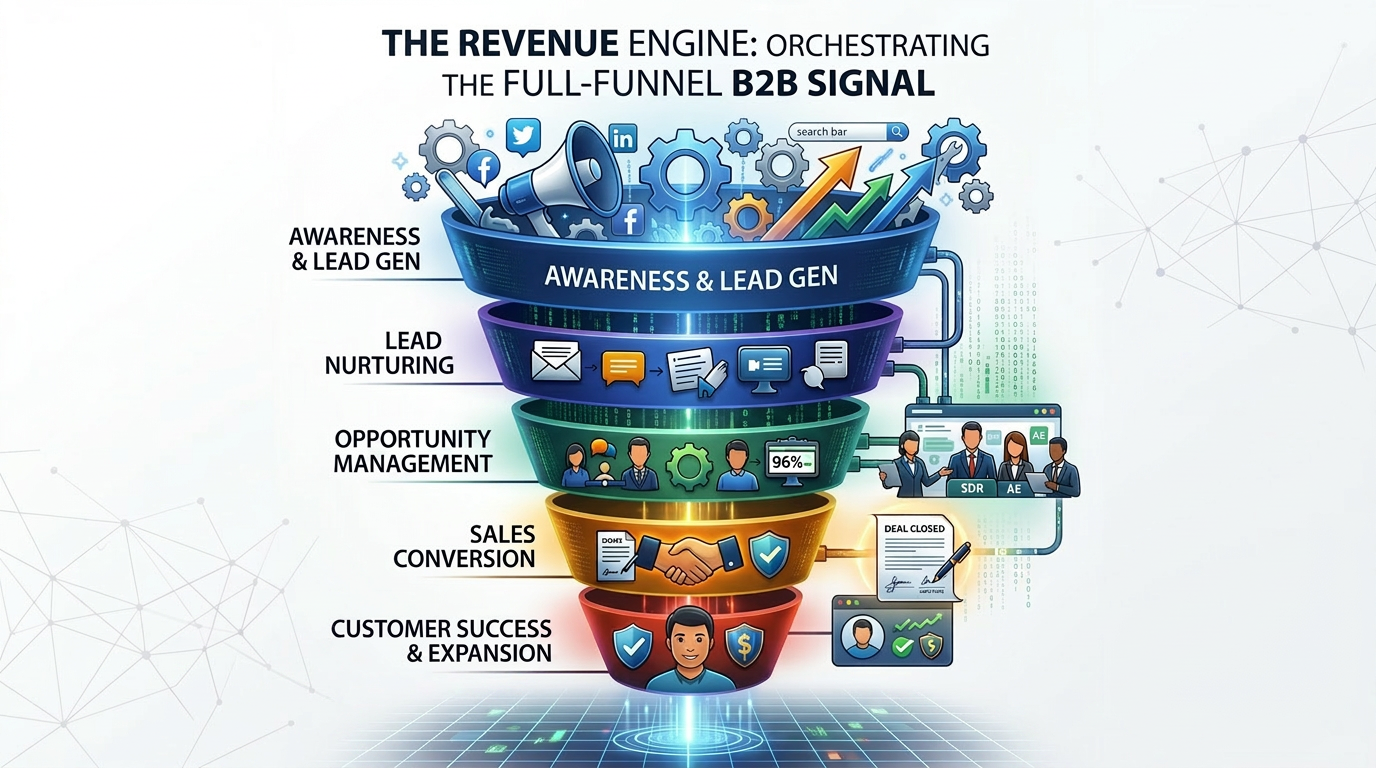
To truly optimize revenue, organizations must orchestrate the entire journey—from lead generation to final CRM win. This article, the first in a three-part series, establishes a high-fidelity quantitative GTM framework for pipeline health, using RFM (Recency, Frequency, Monetary) Segmentation and Media Mix Optimization to the B2B sales cycle. This process is designed to convert fragmented CRM noise into a predictable revenue signal by identifying high-intent accounts and predicting velocity.
The Revenue Engine: Why Orchestrating the B2B Signal Matters
Executive Summary
Given CRM and MRM systems, as well as data lakes, most organizations have the data. Few have the architecture to turn it into a decision. Engineering fragmented pipeline data into a unified architecture is the core value proposition of a Full-Funnel Signal. This shift moves an organization away from intuitive decision-making and toward a Reasoning Engine that leverages strategic and quantitative rigor for growth.
- Revenue Accountability: It transforms marketing from a subjective cost center into a precision-engineered profit driver by establishing direct financial attribution for every program.
- Operational Coherence: It eliminates “random acts of marketing” by anchoring demand generation to a singular, data-driven strategic roadmap that includes program-level targets based on historical data.
- Predictive Precision: It replaces the pipeline “black box” with real-time telemetry across Volume, Velocity, and Value for high-confidence revenue forecasting.
- GTM Synchronization: It dismantles functional silos by establishing a 360-degree decision-support platform, aligning Sales and Marketing around shared data and unified KPIs.
A Note on Data Integrity and Ethics
Before diving into the analysis, it is important to address the “signal” behind this series. To maintain the highest ethical standards and ensure zero overlap with proprietary information from past or current employers, the analysis in this series is conducted on a high-fidelity synthetic dataset.
This environment was custom-built for The Marketing Science Signal using Python-based generative scripts designed to mimic the complexities of a multi-year B2B enterprise funnel and demonstrate enterprise-grade diagnostic techniques without compromising proprietary data. It includes:
- Stochastic Modeling: Lead progression and conversion rates are governed by probability distributions rather than simple linear logic.
- Engineered Noise: Intentional “structural nulls” and data entry inconsistencies were injected to replicate the real-world friction of a mature CRM instance.
- Behavioral Realism: Account tiers and engagement metrics were calibrated to reflect actual B2B buying cycles, allowing for a rigorous “sandbox” to demonstrate advanced quantitative methodologies.
The SFDC Report Card: Data Quality & Profiling
Before modeling, a rigorous Exploratory Data Analysis or EDA (Tukey, 1977) is required to identify data quality issues, sparsity, and distribution. Using a high-fidelity synthetic dataset, we evaluated the base CRM health:
- Column Population: Out of 45 total columns, 32 are fully populated, providing a “Clean Core” of identifiers and engagement metrics.
- Structural Nulls: 13 columns contain Nulls, primarily in late-stage dates (e.g., Legal or Negotiation) and Reject Reasons (77% Null). These are often “structural,” representing deals that dropped out of the funnel before reaching those stages.
- Temporal Consistency: Date ordering must be validated (e.g., ensuring MQL < SAL < SQL) to catch data entry errors or CRM sync issues before performing survival analysis.


Statistical Profile: Opportunity Amount
Summary statistics provide a clear picture of the pipeline’s underlying structure:

- Range and Scale: The opportunity amounts span from a minimum of $5,000 to a maximum of $1,735,700.
- Central Tendency vs. Outliers: There is a massive delta between the median ($67,100) and the mean ($145,442). This 2.2x difference is a textbook indicator that the mean is being pulled upward by high-value “whales”.
- Skewness (3.12): A skewness value of 3.12 indicates a highly right-skewed distribution. Most deals are concentrated at the lower end of the dollar spectrum, with a long tail of increasingly expensive opportunities.
- Kurtosis (13.66): With a kurtosis of 13.66, the distribution is extremely leptokurtic. This means the “peak” of the distribution is very sharp (many small deals) and the “tails” are fat, representing significant outliers that could compromise standard linear models.
- The correlation matrix below indicates that high-activity accounts engage across all channels simultaneously but no channel stands out.
- Finding: High-touch, high purchase-frequency accounts are not necessarily high $ value.

Segmentation: The Concentration of Value
I find it is still popular to forecast revenue and pipeline using averages, such as “pipeline should be 4X revenue targets“. However, in B2B pipeline analysis, treating every deal as an “average” is a recipe for forecasting failure. This EDA reveals that opportunity amounts are highly non-normal. This is the Pareto Principle in action: a small number of accounts generate the majority of revenue which has implications for business risk, forecasting accuracy, marketing mix and account planning.
Statistical Analysis
- Log-Normal Characteristics: The data exhibits high skewness (3.12) and kurtosis (13.66), with deal values ranging from $5k to over $1.7M.
- The Median Mandate: Because the mean ($145k) is more than double the median ($67k), we must use median values for velocity benchmarks. This prevents slow-moving, high-value outliers from skewing our operational “standard”.
- Opportunity Amount shows higher skewness, implying that Champion accounts are exponentially larger outliers. A transparent and intuitive segmentation scheme (which I introduced in my first article entitled My Favorite Segmentation Scheme), RFM is key to understanding the account base and pipeline dynamics.
- Segmentation Strategy: The high kurtosis confirms that most of the sales workload lives in a high-frequency, lower-monetary range. To capture a clean “signal,” future propensity models should be segmented by deal size; a $10k transaction behaves fundamentally differently than a $1M enterprise contract.

Lead Source & Industry Tier Dynamics
The relationship between how a lead enters the funnel and its strategic value is a critical signal for resource allocation. The pivot analysis of 1,000 opportunities reveals a distinct “Tier-Source” correlation that challenges the reliability of simple volume-based reporting.
Lead Sources by Account Tiers
- High-Volume, Lower-Tier Skew: LinkedIn Ads and Webinars provide the largest total lead count (121 and 114, respectively), but these leads are heavily weighted toward Tier 2 (Growth) and Tier 3 (Volume). Tier 1 accounts are fewer, and not heavily represented which suggests a high-touch strategy using Referrals and perhaps Partners (see next bullet).
- High-Quality Signal: Referrals and Partners generate lower total volume but produce a much higher concentration of Tier 1 (Strategic) accounts. For example, 30% of Referral leads are Tier 1, a rate that is double that of Trade Shows (15%). Precision lead routing is key for this segment.
- Industry Hotspots: There is a specific resonance between channels and sectors, with LinkedIn Ads performing strongly in Energy and Education, while Google Ads are dominant in the Education Tier 3 (Volume) market. Align media and messaging to these sectors.

Media Impact on Win Rate
- High-Conversion Outliers: Direct Mail in Manufacturing (42.9%) and Thought Leadership in Financial Services (35.7%) are the most potent combinations, suggesting these industries crave tactile engagement and deep expertise, respectively.
- Critical Friction Points: Events are significantly underperforming in Financial Services (4.5%) and Retail (7.1%), while Product Launches in Technology are surprisingly ineffective at a mere 5.9% win rate.
- Stability vs. Volatility: Nurture campaigns provide the most consistent performance across the board, whereas Retargeting is highly volatile—peaking in Professional Services (33.3%) but crashing in Healthcare (7.7%) suggesting it is context-dependent. Intent scoring or additional firmographic, recommender systems or RFM profiling recommended for Retargeting.

The Lead Velocity Matrix (LVM)
To manage a high-performance revenue engine, you must measure the speed of the “signal” as it moves through the funnel. For these benchmarks, median values must be used rather than means to prevent slow-moving, high-value outliers from distorting operational standards.

High-Level Velocity Observations
- The “Handoff” Black Hole: The data identifies a critical friction point in the SAL-to-SQL transition, which has a median lag of 14 days. This is the primary friction point in the early-stage funnel (before mid-funnel entry) and represents where momentum typically dies.
- Early Funnel Efficiency: The transition from MQL to SAL is relatively efficient with a median of 7 days, suggesting that the initial handoff from Marketing to Sales is functioning well.
- Middle-Funnel Stagnation: Significant friction appears once an opportunity reaches the middle funnel. Stage 2 to Stage 3 requires a median of 20 days, the single longest transition in the entire journey.
- The Median Advantage: The importance of median-based tracking is proven by the Total Cycle Days; the mean (61 days) is skewed nearly 15% higher than the median (53 days) due to a small number of complex, slow-moving deals.
Strategic Action Items
- Friction Audit: A targeted audit of the SAL-to-SQL workflow is required. If this 14-day delay is driven by human scheduling or administrative hurdles rather than lead quality, resolving it is an “easy win” for immediate pipeline acceleration.
- Stage 2 Intervention: Investigate the 20-day “stagnation” between Stage 2 (Needs Analysis) and Stage 3 (Proposal). This often indicates a lack of standardized proposal templates or a breakdown in the technical discovery process.
- Predictive Calibration: Use the 9-day median for SQL to Stage 1 as the baseline for “healthy” initial discovery. Any opportunity exceeding this threshold should be flagged for proactive intervention by sales leadership.
Friction & Loss Diagnostics
By segmenting pipeline losses through the lens of RFM (Recency, Frequency, Monetary) scores, we can move beyond generic “lost deal” reporting to identify the specific root causes of funnel friction.
- Cold Segments: These leads are primarily disqualified for being “Not a Fit”. This is a clear signal to refine Top-of-Funnel (ToF) targeting to reduce “noise” and prevent sales bandwidth from being consumed by accounts that will never convert.
- Champion Segments: These high-frequency, high-intent leads are rarely lost due to poor fit. Instead, they are typically lost to “Competitor Won” or “No Budget”. These accounts require defensive sales strategies and differentiated value propositions rather than better targeting.

Strategic Implication: Continual contact, rather than competitive take-outs and pricing actions, can result in improved win rates by ensuring that this hypothetical company is under consideration when any purchase decision is made.

The “Point of No Return”
A deep dive into the temporal data reveals a counter-intuitive reality regarding B2B cycle times that challenges the “average” duration assumptions I have often seen used by Finance and GTM leaders who are often keen to compress the purchase cycle in an effort to increase revenue.
- Closed Won Average: 66 days.
- Closed Lost Average: 55 days.
High-Level Observation: The “Fail Fast” Reality
In this company, “failing fast” is a statistical reality — lost deals exit the funnel approximately 12 days sooner than successful wins. This indicates a healthy disqualification process where “Lost” deals are identified and purged relatively quickly, while “Won” deals require a longer, more intensive nurturing cycle to reach the finish line.
Understanding this delta is critical for revenue timing. It allows leadership to set more realistic expectations; if a deal has been in the funnel for 60+ days, it has officially crossed the “Point of No Return” where the probability of a win increases — provided the momentum is maintained. The data bears this out directly: any opportunity exceeding 60 days shows a win rate of 68%, nearly 22 points higher than deals resolved before that threshold. For GTM professionals accustomed to rewarding pipeline velocity above all else, this may be counter-intuitive — but in this company, patience is the edge.
A critical assumption underpins this analysis: that Account Executives are maintaining CRM records with rigor and discipline. If abandoned or stalled opportunities are left open rather than formally marked as Lost, the cycle time data becomes corrupted — artificially inflating average durations and obscuring the true “Point of No Return” threshold. Clean pipeline hygiene is not just an operational courtesy; it is a prerequisite for this diagnostic to be reliable.
Pipeline Health
When we combine RFM Segmentation (My Favorite Segmentation) and Opportunity Amount, we can diagnose Pipeline Health:

This is a critical diagnostic for achieving target revenue:
- Total pipeline stands at $145M across all six RFM segments and eight industries.
- $51.8M (36%) is tied to At Risk or Hibernating accounts — the least likely to close Won. That’s more than a third of the pipeline sitting in segments signalling disengagement or churn risk, a clear indicator of poor pipeline health.
- Only $22.5M (15%) is backed by Champions and Loyals — the accounts most likely to convert and expand — leaving revenue confidence thin and over-reliant on unproven segments like Potential and Promising to carry the number.
Mike The Robot
I also imported this dataset to my Mike Agent from Mike The Robot: Scaling Expertise Into The Singularity and obtained this analysis and recommendations.
Here are the high-level observations:
1. The Sophistication of “Sales Velocity” Profiling
The “Speed of Rejection” vs. “The Winning Pace” is a high-signal GTM diagnostic.
- Diagnostic Precision: Most companies only look at average sales cycle length. Distinguishing that lost deals exit the funnel 12 days sooner than wins is a meaningful analytical nuance — one that reframes velocity as a quality signal, not just a speed metric.
- Strategic Takeaway: This suggests that friction isn’t just about moving faster — it’s about moving correctly. The Stage 2 to Stage 3 transition is the primary filter for deal quality.
2. Quantifying “Revenue Confidence” over Pipeline Volume
The “Champion Loyalty Gap” reframes how leadership should read the pipeline number.
- From Quantity to Quality: While a traditional marketing report headlines a “$145M Pipeline,” this assessment immediately de-risks that figure — 36% is tied to At Risk or Hibernating accounts, and only 15% is backed by Champions and Loyals. The headline number obscures the revenue confidence problem underneath it.
- The CFO’s Lens: This is the diagnostic a finance leader needs to set realistic revenue expectations — not the volume number alone.
3. Identification of the “Handoff Black Hole”
The specific identification of the 14-day SAL-to-SQL latency gives the data teeth.
- Operational Impact: This is a classic low-hanging fruit intervention — a process friction point that, if resolved, accelerates every deal behind it.
- Data Science Rigor: Quantifying the specific transition lag moves the conversation from opinion to statistical necessity, providing the mathematical justification for a targeted process audit.

I will return to this in Part 2 of this series.

Looking Ahead: From Profiling to Prediction
This foundational pass through Data Quality, EDA, and Profiling ensures that the signal we are measuring is accurate and meaningful. We have established the statistical case for median-based operational standards, identified the Tier-Source dynamics that separate high-quality lead channels from volume noise, and diagnosed the velocity friction points — particularly the SAL-to-SQL handoff and Stage 2→3 stagnation — that slow the revenue engine. The “Point of No Return” analysis adds a counter-intuitive but data-supported constraint: in this pipeline, patience is the edge. And the RFM Pipeline Health heatmap gives leadership a single, defensible GTM KPI to replace the headline pipeline number.
The Mike Agent output validates these findings from a different analytical angle — and points toward where the next layer of intelligence lives.
In Part 2, we will move from profiling to prediction. We will build a Propensity-to-Buy Model that operationalizes these EDA findings into a scoring engine, and explore how to embed that intelligence into an AI Agent that can predict velocity and automate discovery workflows at scale.
Academic & Technical Citations
Michael E. Foley (2026, April 16). The Revenue Engine: Orchestrating the Full-Funnel B2B Signal. The Marketing Science Signal. https://mikesdatamarketing.com/2026/04/16/the-revenue-engine-orchestrating-the-full-funnel-b2b-signal/
BibTeX Entry:
@article{mike2026revenueengine,
author = {Mike},
title = {The Revenue Engine: Orchestrating the Full-Funnel B2B Signal},
journal = {The Marketing Science Signal},
year = {2026},
month = {April},
day = {16},
url = {https://mikesdatamarketing.com/2026/04/16/the-revenue-engine-orchestrating-the-full-funnel-b2b-signal/},
keywords = {B2B Pipeline, RFM Segmentation, Lead Velocity, Exploratory Data Analysis, CRM Health, Marketing Science}
}
Technical Keywords & Methodology Index
- Methodology: Full-Funnel Orchestration , RFM (Recency, Frequency, Monetary) Segmentation , Exploratory Data Analysis (EDA), Sales Velocity Profiling, Stochastic Pipeline Modeling, Pipeline Health Diagnostics.
- Statistical Concepts: Skewness & Kurtosis (Leptokurtic distribution) , Log-Normal Skewness , Median vs. Mean Velocity Benchmarking, Outlier Detection, Funnel Friction Quantization, Non-Normal Data Profiling.
- Feature Engineering & Data Integrity: CRM Structural Nulls Analysis, Temporal Consistency Auditing, Data Sparsity Management, Synthetic Dataset Generation, Pipeline Hygiene Standards.
- Revenue Operations (RevOps) & Business Intelligence: Revenue Confidence Metrics, Lead Velocity Matrix (LVM), SAL-to-SQL Latency Analysis, Point of No Return Thresholding, Funnel Stagnation Diagnostics, GTM Resource Allocation.
- Systems Architecture & AI: Agentic Decision Support, Predictive Telemetry, Reasoning Engine Architecture, Full-Funnel Signal Integration, Automated Discovery Workflows.
Further Reading & Technical References
- On RFM Segmentation in B2B: Fader, P. S., & Hardie, B. G. (2009). Probability Models for Customer-Base Analysis. Journal of Interactive Marketing. (Foundational theory for the “Champions vs. Hibernating” segments applied in this article ).
- On Lead Velocity & Funnel Friction: Sabnis, G., et al. (2013). The Sales Lead Black Hole: On Salesperson Follow-up of Marketing Leads. Journal of Marketing. (Context for the “SAL-to-SQL Black Hole” and friction points identified in the LVM ).
- On Exploratory Data Analysis: Tukey, J. W. (1977). Exploratory Data Analysis. (The gold standard for the data profiling and statistical distributions utilized in the SFDC “Report Card” ).
Leave a Reply